Home • Case Study Gallery
04 // Applied Works & Technical Prototypes

Applied Financial Engineering & Analysis

Practical applications demonstrating analytical rigor in corporate financial modeling, computerized ledger systems, and quantitative business intelligence.

Featured Case Studies

Click “Examine Case Study” on any project to inspect the analytical framework, technical methodology, and key takeaways.

Case Study // 01 Financial Analysis & DuPont Ratio Modeling
DuPont 3-Stage Model Liquidity Analysis Benchmarking

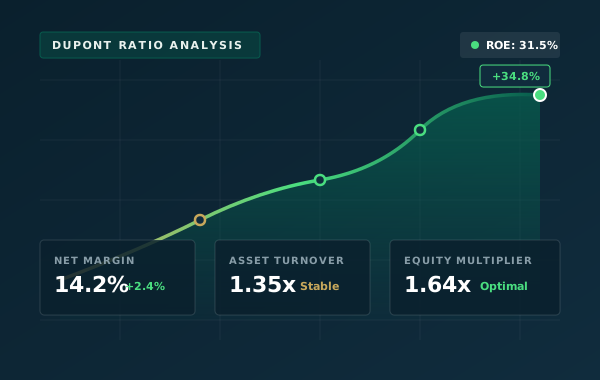
Financial Statement & Ratio Analysis

In-depth horizontal, vertical, and DuPont decomposition of corporate financial statements to isolate operational drivers of equity profitability and working capital health.
Case Study // 02 Accounting Projects & Ledger Workflows
General Ledger Trial Balance Automation QuickBooks

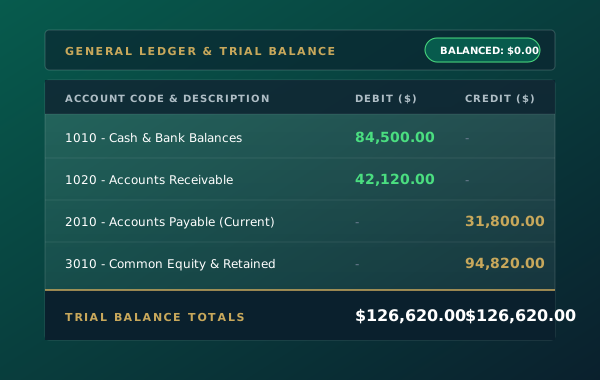
Accounting Projects & Ledger Systems

Hands-on computerized accounting exercises implementing double-entry book closing, structured chart of accounts, and automated trial balance verification.

Case Study // 03 Data Analysis & BI Dashboards
Excel Modeling Variance Alerts Python ETL

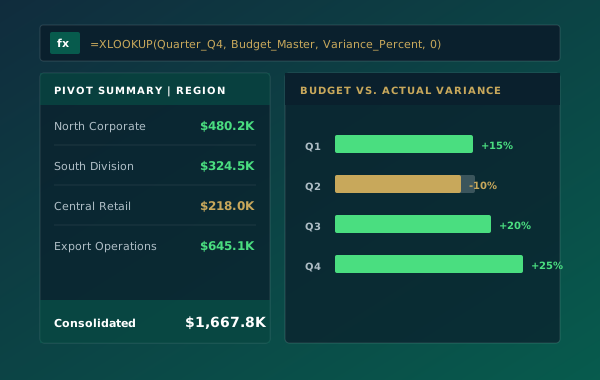
Data Analysis & Dynamic Dashboards

Leveraging Microsoft Excel formulas, automated PivotTables, and Python scripts to transform raw corporate data into interactive executive variance dashboards.

Case Study // 04 Bangladesh Industrial Sector Research
Sector Benchmarks Capital Productivity Treasury Safeguards

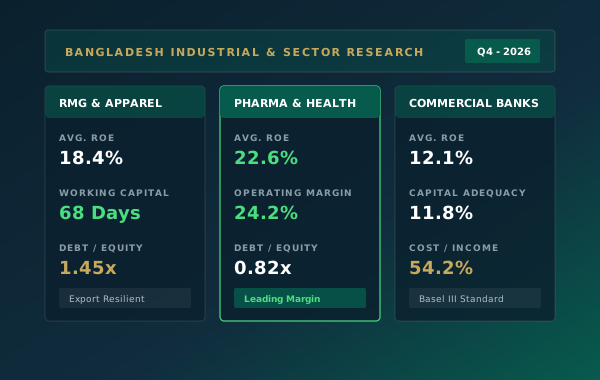
Bangladesh Industrial Sector Research

Sector-level financial and operational comparative study evaluating the resilience, working capital cycles, and capital structure of Bangladeshi industries.

Engineering Lifecycle: From Problem to Decision Support

A disciplined 4-stage pipeline applied across every case study to ensure methodological integrity and actionable value.

Stage 01 // Definition

IFRS & Statutory Scoping

Formulating analytical requirements against regulatory frameworks (IAS 1, IFRS 15, IFRS 9). Ensuring compliance with statutory financial reporting conventions and establishing clear objective metrics.

Stage 02 // Data Ingestion

Normalization & Integrity Controls

Ingesting raw general ledgers or public financial statements. Applying automated Python scripts or Excel Power Query to eliminate discrepancies and enforce double-entry validation.

Stage 03 // Computation

Dynamic Formulaic Modeling

Building sensitivity models with dynamic arrays (XLOOKUP, INDEX/MATCH). Executing cross-sectional ratio decompositions, cash flow projections, and liquidity stress testing.

Stage 04 // Delivery

Executive Board-Ready Delivery

Synthesizing complex multi-year figures into visual dashboards with clear conditional formatting, variance alerts, and concise executive summary commentary for leadership.